As an official Microsoft Power BI Partner, we support our clients on their journey to data-driven organisations.

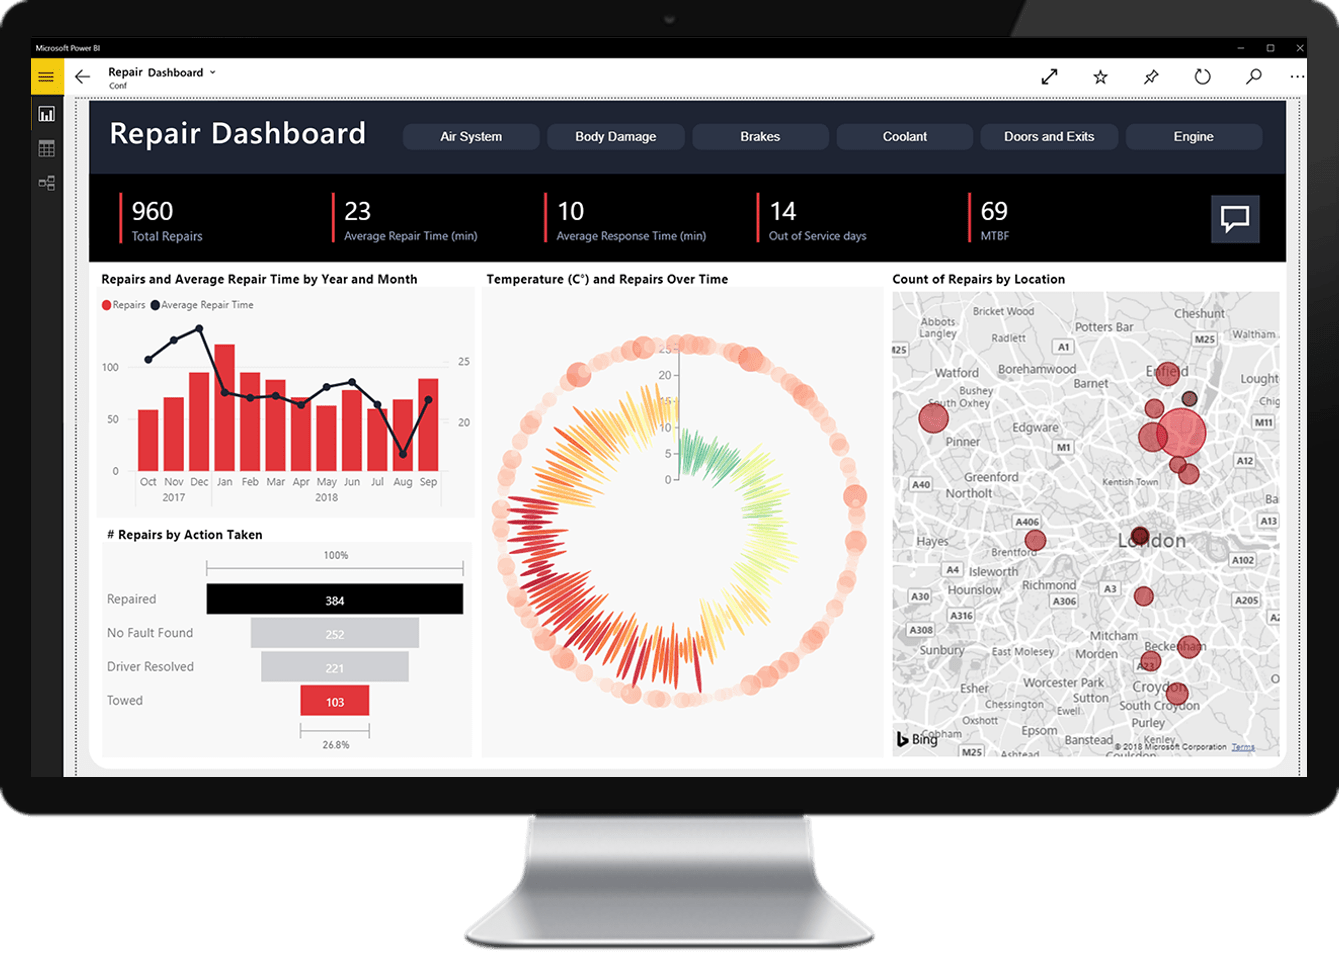
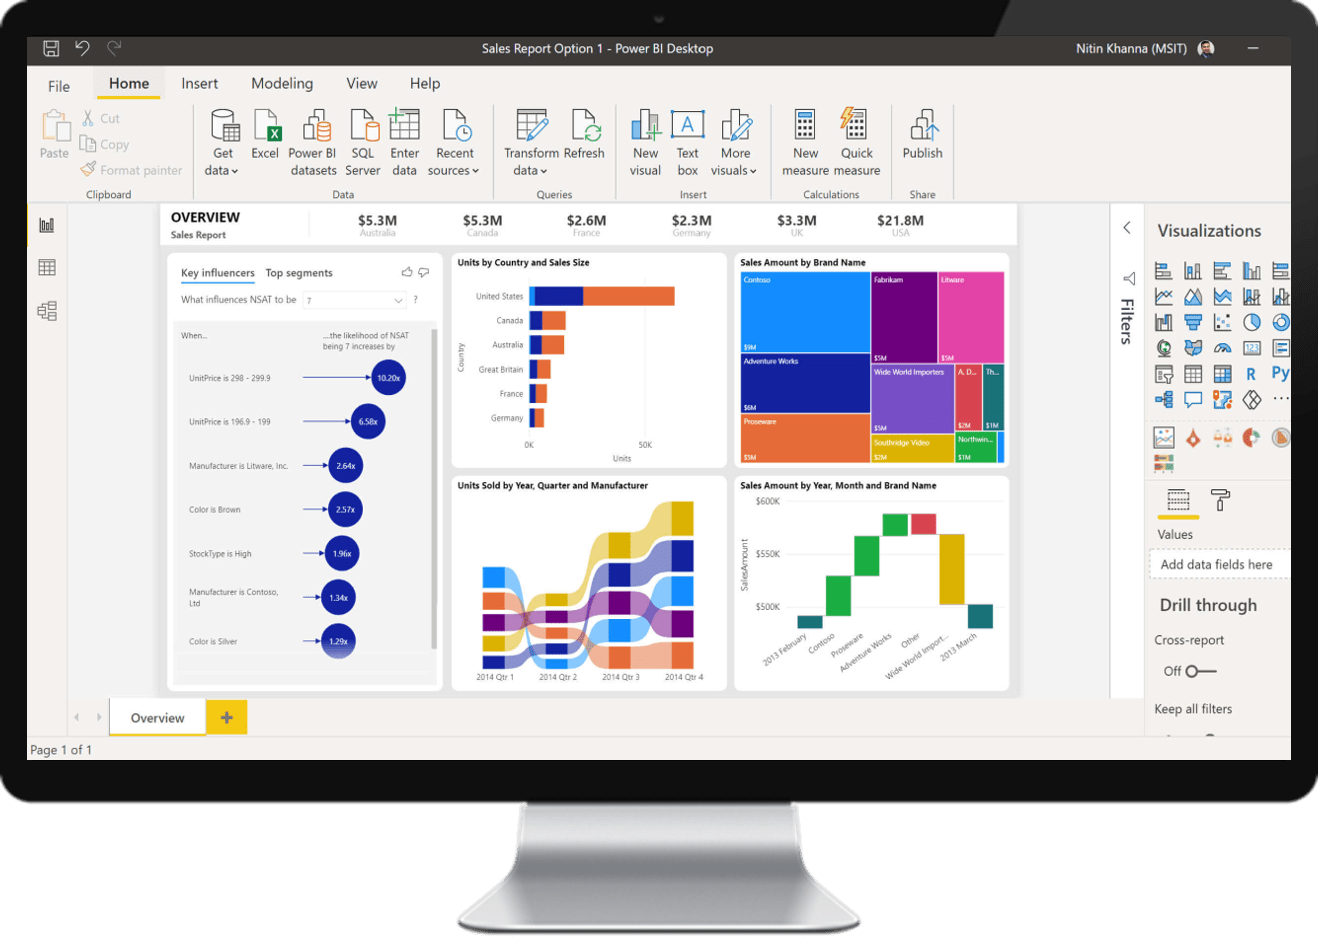
Power BI offers you a wide range of possibilities to control your organisation in a data-driven way by combining all relevant data from various data sources. With Power BI you can bundle the most diverse data sources, figures and facts of your organisation in one application. The clear and automated dashboards of Power BI save tedious reporting steps and provide new insights and more time for the essentials through links and visualisations: The analysis and the exchange based on it in your team on the way to data-driven decisions.

As a component of the Microsoft product landscape, Power BI also offers natural and efficient integration into your Microsoft infrastructure. This means that data from Microsoft applications and the Azure environment can be imported into Power BI particularly easily.
Dashboards can be flexibly shared within teams in chats and channels, making efficient, virtual collaboration even easier.
Novalytica supported SBV in the conception and implementation of their data infrastructure in Microsoft Azure, the connection of all data interfaces as well as the preparation and visualisation of the data in Microsoft Power BI. This way, the reporting effort for internal and external target groups was reduced and easier access to data-based decisions was achieved.
A Swiss logistics provider commissioned Novalytica to design and create an analysis dashboard with the aim of gaining a better understanding of the economic and socio-demographic environment of its branches. Novalytica realised this assignment with Microsoft Power BI. The developed interactive data application connects internal data sources with a variety of external data sources (Bureau of Statistics and online sources) and thus provides an overview of local conditions with just a few clicks, which simplifies discussions with internal and external stakeholders.
The core tasks of this project were the conceptual definition of economically meaningful parameters, preparation of the parameters into meaningful KPIs, conception and creation of the BI dashboard as well as the introduction and training of the staff for the successful use of Power BI in the future.
A Swiss organisation contracted Novalytica to link the company’s existing data with additional data sources and to analyse it with Business Intelligence-tools. The BI-dashboards break down past developments in order to model future trends and derive recommendations for action. This project was successfully carried out by Novalytica using Microsoft Power BI.
First, anonymised personal data on the customers was collected and broken down and visualised with the help of Power BI. From the dashboards, it was then possible to visualise the current socio-demographic composition of the customers. This enabled the identification of trends in the customer composition, which is crucial for an effective target group approach. Thanks to Novalytica’s BI solution, the understanding of the customers was improved and the time for reporting activities is minimised.
Analysis of the existing infrastructure, prerequisites and needs.
Analysis of the data origin and possibilities for integration.
Definition of the data displayed and its presentation, conception of the design.
Create the designed reports with different access rights, as required.
Introduction to the functionalities in the use of reports, training of key users for the development and adjustment of reports.
Feedback loop for adjusting the developed reports.