Data is present in almost all areas of life. We are surrounded by a veritable flood of data that is increasing exponentially and can take on different forms. How can this flood of data be managed so that information is created and a flood of knowledge is generated from it? The key to this lies in data literacy.
In our blog series on the topic of “data literacy”, the topic is examined using various building blocks. The first part begins with a general definition of the term and an explanation of why data literacy is also referred to as the “competence of the 21st century”.

Definition and delimitation
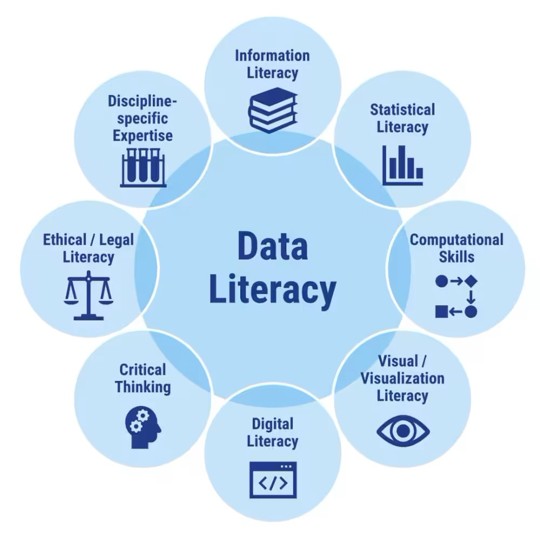
Data literacy is a set of skills and abilities at the interface of various related competencies, such as information literacy or critical thinking. For this reason, there are various narrow and broad definitions. In this blog series, we will use the definition by Schüller et al. (2019), which covers the entire cycle up to data-driven decision-making:
“Data literacy is the cluster of all efficient behaviors and attitudes for the
effective execution of all process steps for value creation or decision-making from data.” (Schüller et al., 2019, p. 26)
https://www.dataliteracy.uni-jena.de/was-ist-data-literacy
Data literacy therefore enables data to be collected, processed, presented and analyzed in such a way that added value is created and data-driven decisions can be made.
Data literacy includes a range of different skills and abilities that can be summarized in five areas (according to Ridsdale et al., 2015):
Conceptual framework
This includes general data basics, such as knowing what data is generated in the company and what makes it a valuable resource. This framework also includes an established data culture and the necessary tools and techniques to implement it.
Collecting data
This area includes skills for collecting, organizing and processing data. For example, the uniform collection and organization of customer data in a CRM.
Manage data
This area mainly includes skills and abilities for basic data analysis, interpreting data and using data tools. An example of this is importing and visualizing CRM data in a Microsoft Power BI dashboard.
Evaluating data
In addition to identifying problems in the use of data, evaluating data also involves visualizing and verbally presenting data and making data-based decisions. In the example with the CRM data, for example, gaps in the data, such as missing gender designations, could be a problem. CRM data can be used to derive important information for the more efficient conversion of leads to deals, and sales can be strategically aligned accordingly.
Use data
On the one hand, this includes evaluating the data-based decisions mentioned above. Have the strategic changes in the sales process made a difference? And if not, what needs to be adjusted? It also includes sharing and citing data, for example in an (internal) report on the results of a data analysis. This module also includes aspects of data ethics, i.e. which customer data may be collected and how it may be used.
From data to added value
Data literacy is the ability to generate added value from data. But what actually is data and how can added value be created from it?
Data can be seen as a raw material that represents the real world. Information is generated by cleansing and linking this data. Knowledge, in turn, is created by analyzing this data. However, added value, so-called “action knowledge”, is only created when the data is also interpreted and used in a meaningful way. (Schüller et al. 2019)

From data collection to data-driven decision-making, the data passes through various stages along a cycle.

As the broad definition has shown, data literacy cannot be reduced to one stage. In the following articles in this series, we will therefore look at the following areas of the data cycle:
- Data Collection: How do you collect data? Where do you find data? What is the quality of the data source and its data?
- Data processing: How is raw data prepared for subsequent analysis?
- Data Analysis: How can data be analyzed using statistical methods and machine learning algorithms?
- Data Visualization: How can data visualization be used to analyze and interpret data? What needs to be considered in order to use visualizations as a means of communication?
- Data-driven decisions: How can data-based decisions be made based on data analysis and visualization?
Data literacy is a multifaceted area of competence that requires a wide range of skills and abilities. The data cycle covers the individual stages that are necessary to generate knowledge from raw data using data literacy.
Novalytica’s experts support you with customized courses to promote and develop your employees’ data skills in a targeted manner.
Sources used
Ridsdale, C., Rothwell, J., Smit, M., Bliemel, M., Irvine, D., Kelley, D., Matwin, S., Wuetherick, B., & Ali-Hassan, H. (2015). Strategies and best practices for data literacy education knowledge synthesis report. https://doi.org/10.13140/RG.2.1.1922.5044
Schüller, K., Busch, P., Hindinger, C. (2019). Future Skills: A Framework for Data Literacy – Competence Framework and Research Report. Working Paper No. 47. Berlin: Hochschulforum Digitalisierung. https://doi.org/10.5281/zenodo.3349865